Environment
Managing Chemical Substances
Preventing Pollution and Managing Chemical Substances
We are working for the prevention of air and water pollution, the appropriate management of toxic chemical substances, and the reduction of related emissions.
Note:
For data of indicators related to climate change and environment protection, we have received third-party assurance to ensure the reliability and transparency of Data Sheet 2025 .
For indicator data, some calculation methods have been changed. For details, please refer to “Calculation Methods for Data of Indicators related to Environment.”
The reporting scope covers Kaneka, 51 Group companies in Japan, and 16 overseas Group companies. For a list of companies, please see “Reporting Organizations.”
Preventing Air Pollution
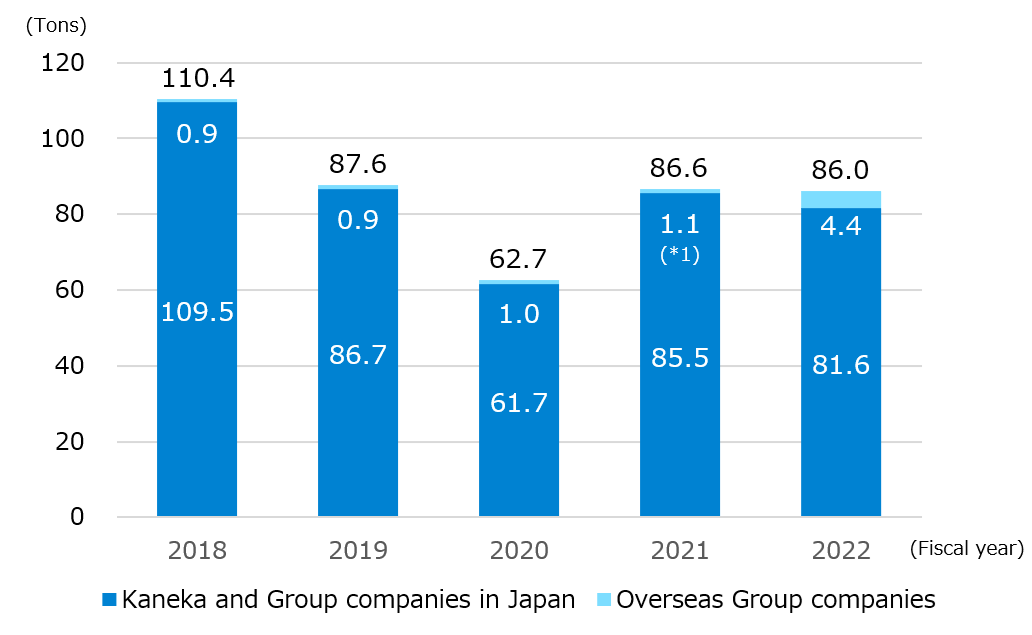
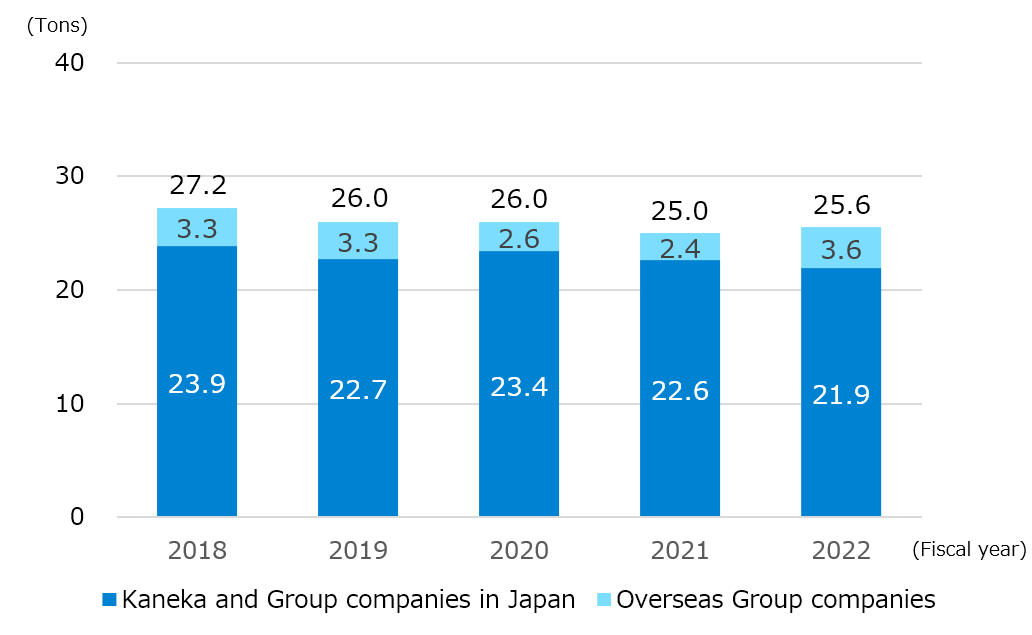
Our production activities comply with the standards stipulated in the Air Pollution Control Act as well as the criteria in agreements with local governments, and we have established our own internal targets that are stricter than those criteria.
SOx, NOx, and soot and dust emissions from all parent manufacturing sites increased in FY2024 from the previous fiscal year. This was mainly because operating hours of coal-fired boilers returning to normal levels.
Note: Amounts reported here may not fully match, due to rounding.
SOx Emissions(*1)
NOx Emissions(*1, 2)
Soot and Dust Emissions(*1, 2)
*1From FY2024, applies in principle to facilities for which measurement is required. For the Kaneka Malaysia Group, facilities that do not involve fuel combustion are not included.
*2FY2023 figures for some Group companies in Japan were revised because some data had been omitted.
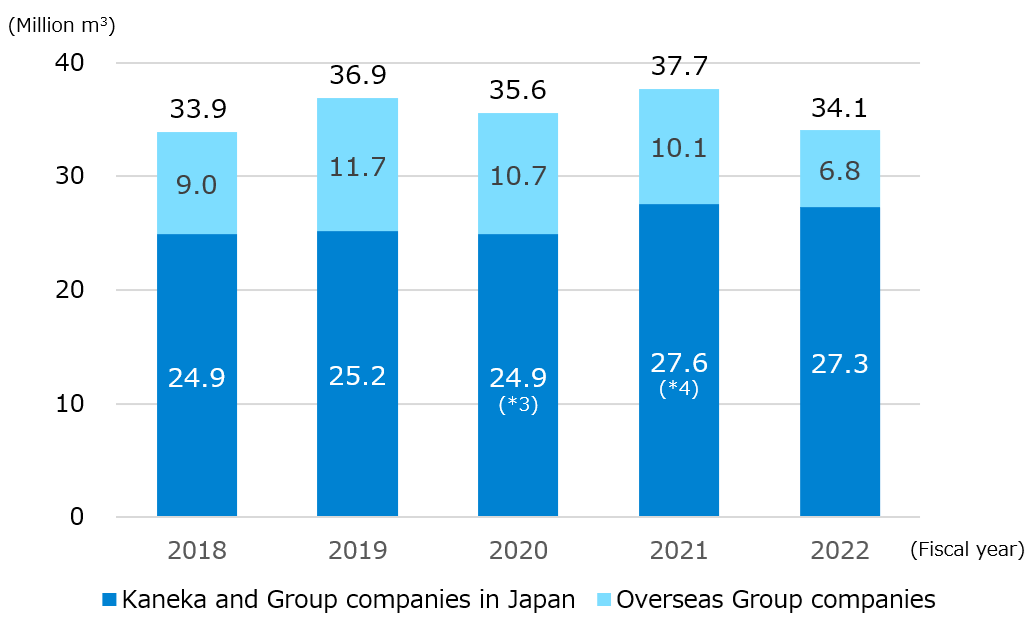
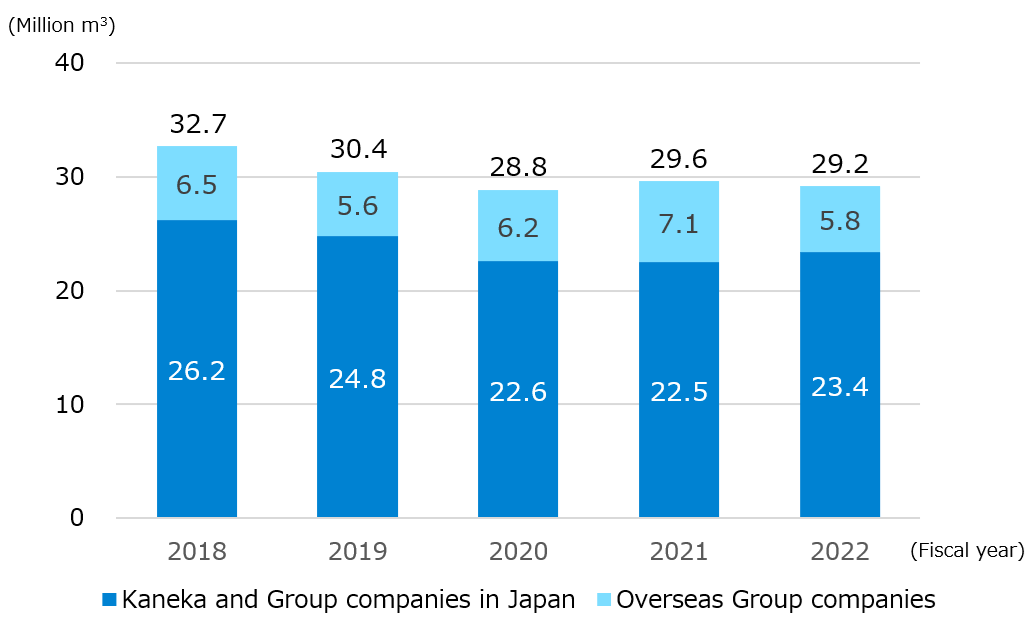
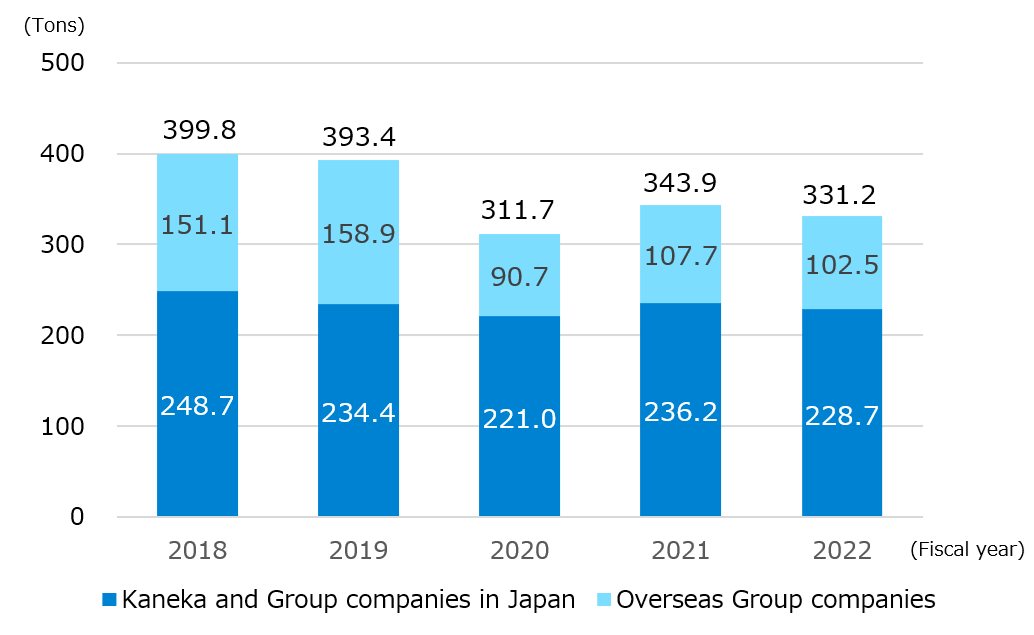
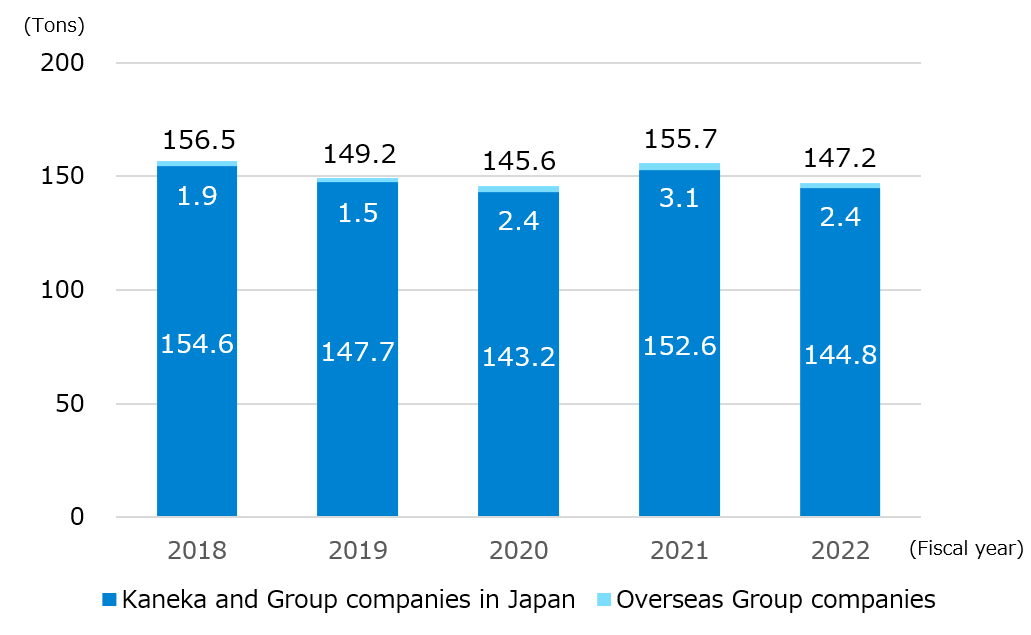
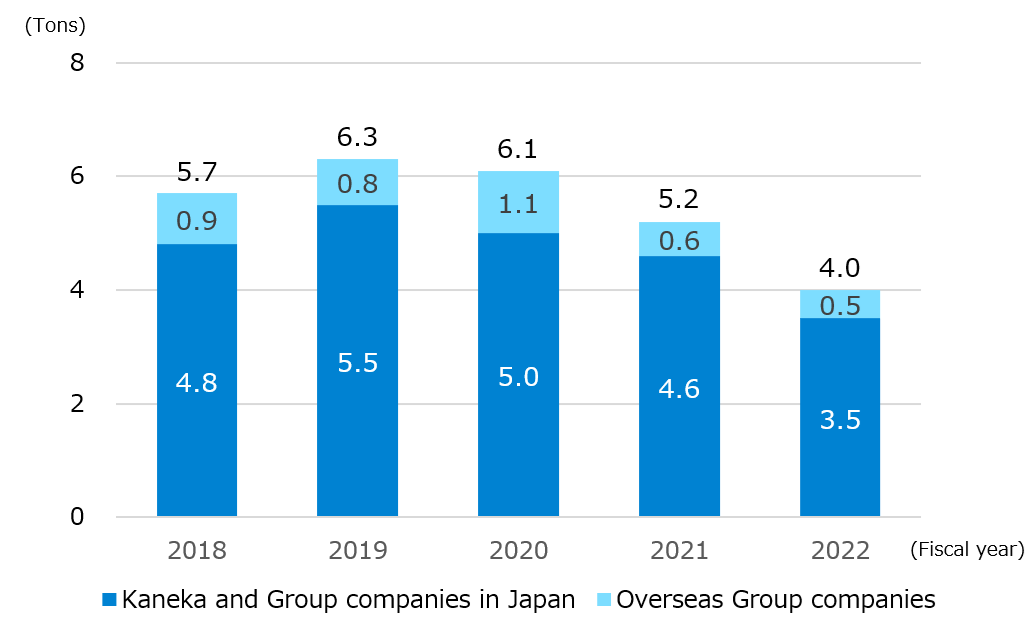
Water Conservation
Our production activities comply with the standards stipulated in the Water Pollution Control Act as well as the criteria in agreements with local governments.
In FY2024, Kaneka Group withdrew 36.2 million m3 of water and discharged 31.8 million m3 of wastewater.
To conserve water resources, we monitor the amount of water intake and strive to use water efficiently. To prevent water pollution, we aim to maintain and improve the quality of wastewater discharged into public water bodies.
For water risk assessments, we use an assessment tool (Aqueduct Water Risk Atlas) to identify areas with high water stress at each Kaneka Group site and the bases of Group companies in Japan and overseas. By looking at the share of water intake from those areas in our total water intake, we have confirmed that Kaneka Group as a whole does not face high water risks. Going forward, we will broaden the geographical and time scope of our assessments, and implement prioritized measures based on the results.
Note:Amounts reported here may not fully match, due to rounding.
Water Consumption (Intake) (*3, 4, 5)
Wastewater Discharges(*3, 4, 6)
Chemical Oxygen Demand in Discharged into Public Bodies of Water(*3, 4, 6, 7)
Nitrogen in Wastewater Discharged into Public Bodies of Water(*3, 4, 6, 7)
Phosphorus in Wastewater Discharged into Public Bodies of Water(*3, 4, 6, 7)
Suspended Solids in Wastewater Discharged into Public Bodies of Water(*3, 4, 6, 7)
*3 It also includes those generated from non-manufacturing facilities other than the plant department.
*4 FY2023 figures were revised following the discovery of data omissions and calculation errors.
*5 Does not include water consumption at the tank yard of Kaneka Malaysia.
*6 Does not include wastewater discharges at the tank yard of Kaneka Malaysia.
*7 From FY2024, includes only sites for which water quality measurement is required.
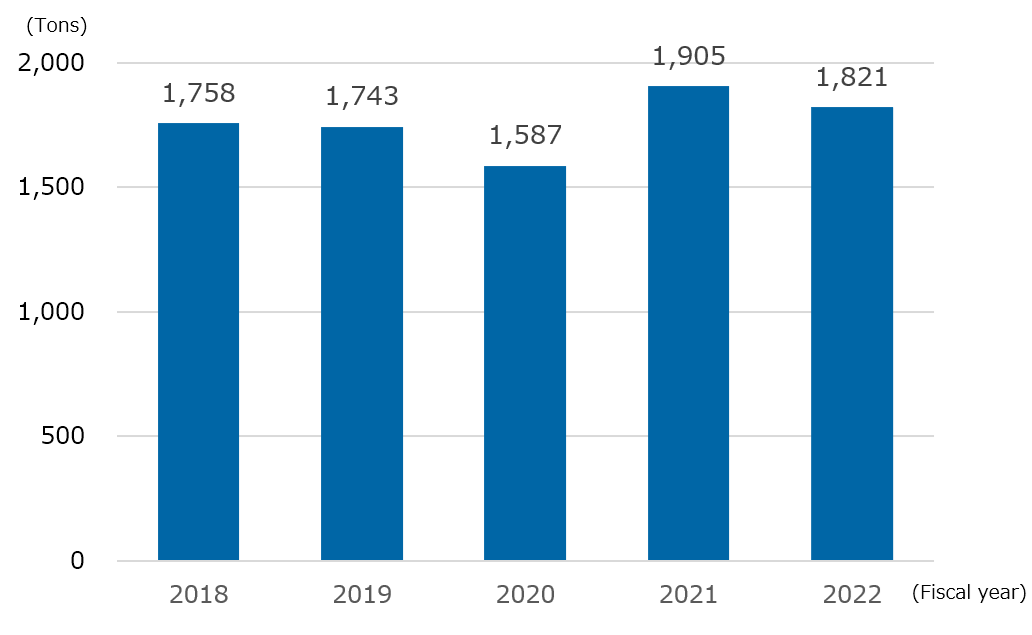
Volatile Organic Compounds Emission Reductions
We are committed to reducing the emission of VOCs(*8), which are known to cause photochemical smog. In FY2015, we at Kaneka set the goal of controlling VOC emissions to below 1,800 tons.
In FY2024, VOC emissions totaled 1,728 tons, an increase of 2.5% from the previous fiscal year, achieving our target.
To reduce VOC emissions, we are improving the recovery rate of acetone, which accounts for 46% of VOC emissions, by upgrading refrigeration equipment to increase cooling capacity. We will continue our efforts to manage and reduce VOC emissions.
*8 Volatile Organic Compounds (VOCs) are organic chemical substances that cause suspended particulate matter and photochemical oxidants.
VOC Emissions (Kaneka)
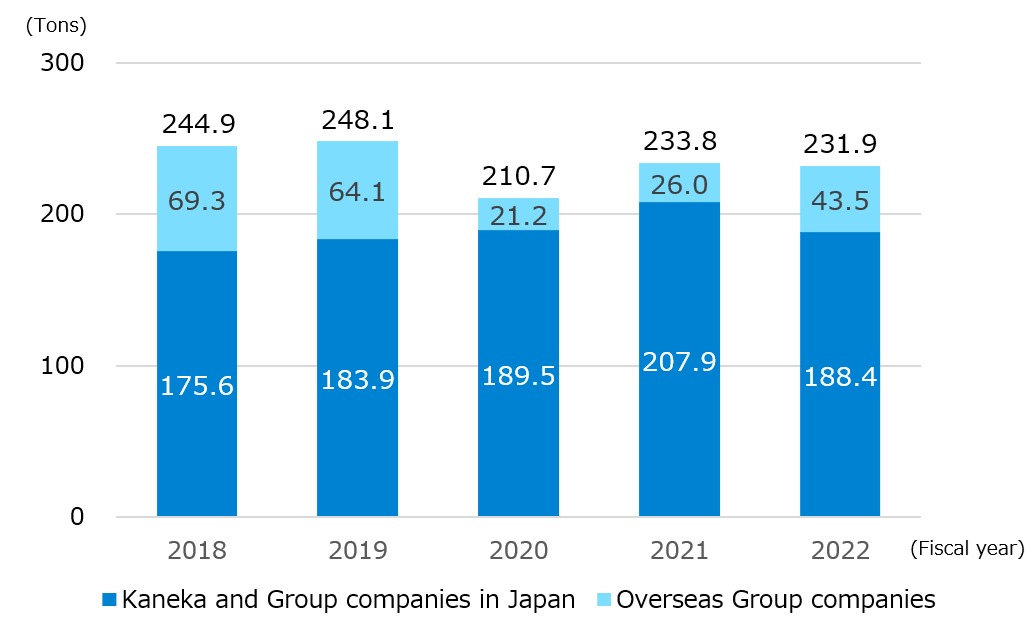
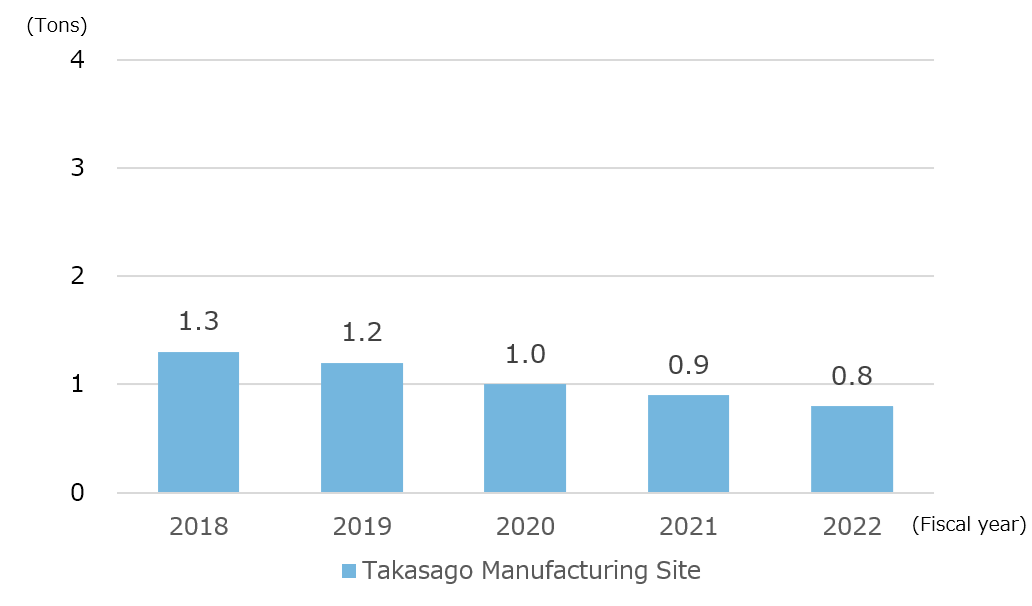
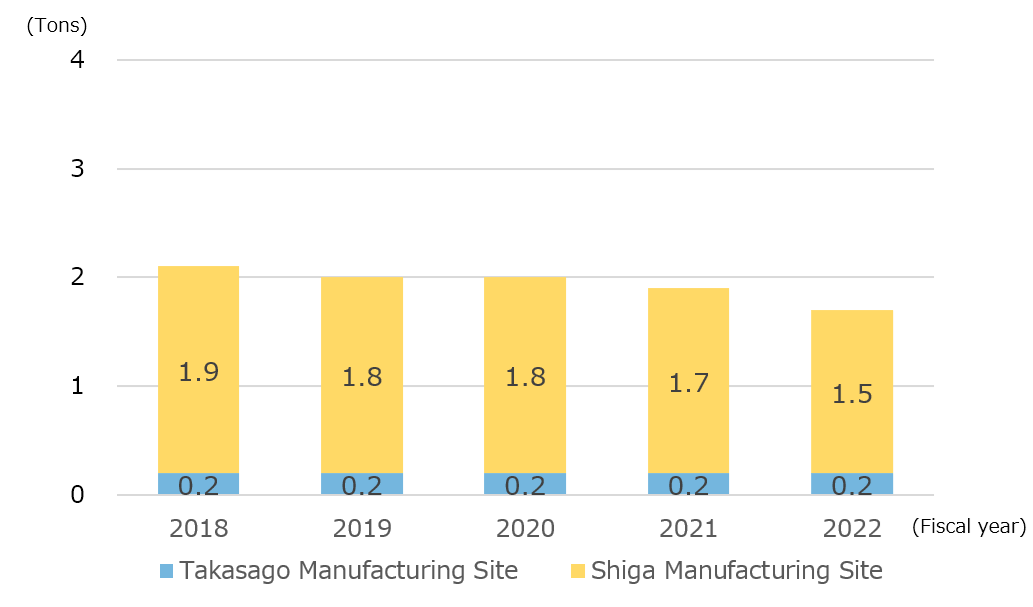
Hazardous Air Pollutants
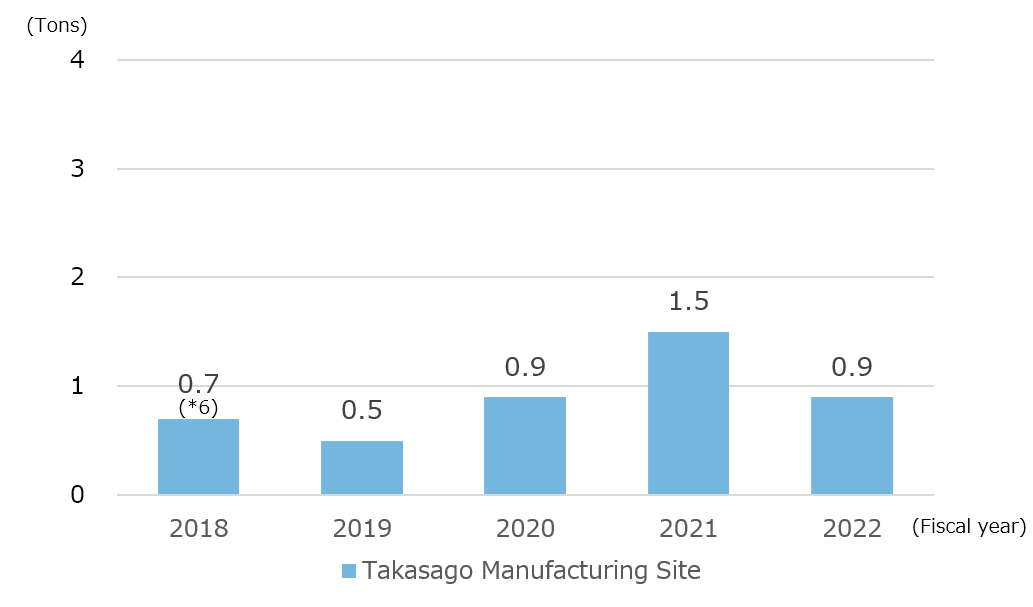
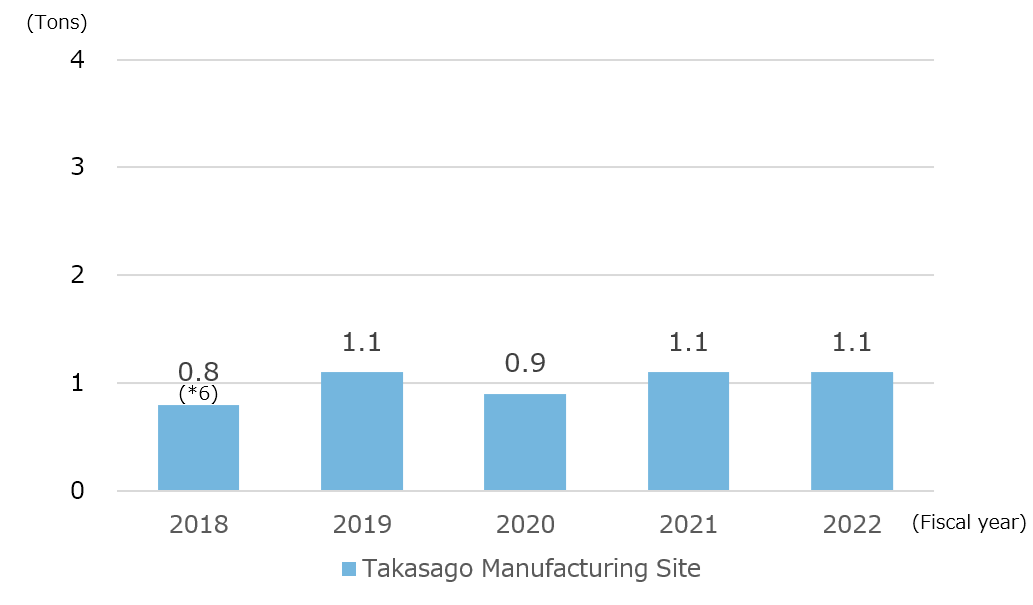
In FY2024, total emissions of the six hazardous air pollutants targeted by Kaneka for voluntary reduction amounted to 22.2 tons, a 15.5% increase from 19.2 tons in the previous fiscal year. This was primarily due to a temporary increase in emissions of chloroethylene and 1,2 dichloroethane emissions following a power outage at the Takasago Manufacturing Site in April 2024, caused by hail associated with atmospheric instability.
At the Takasago Manufacturing Site, we are strengthening facility management to reduce emissions of these hazardous air pollutants.
We will continue working to control emissions and reduce our environmental impact.
Chloroethylene Emissions
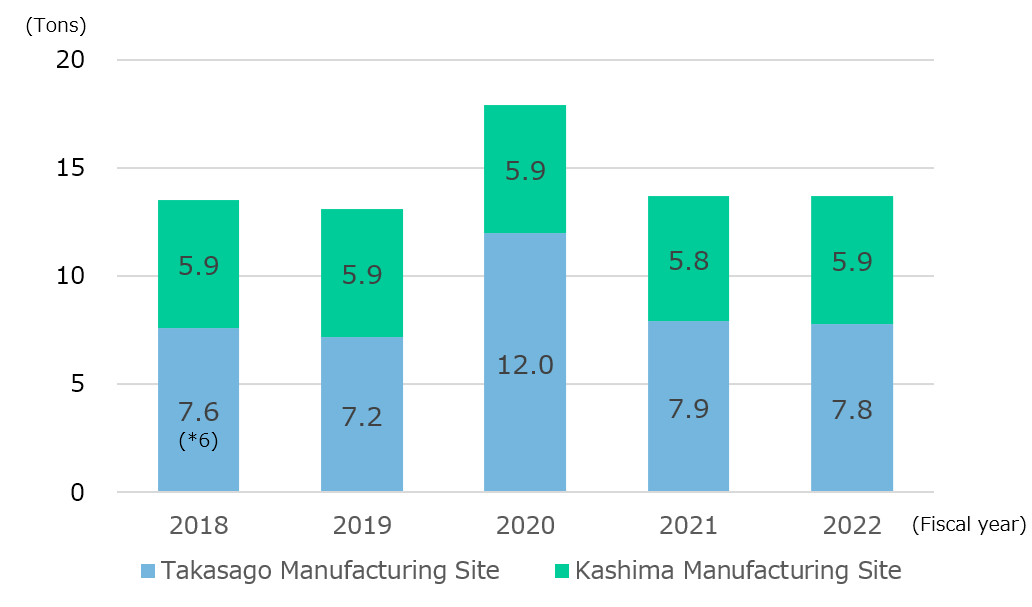
1,2-Dichloroethane Emissions
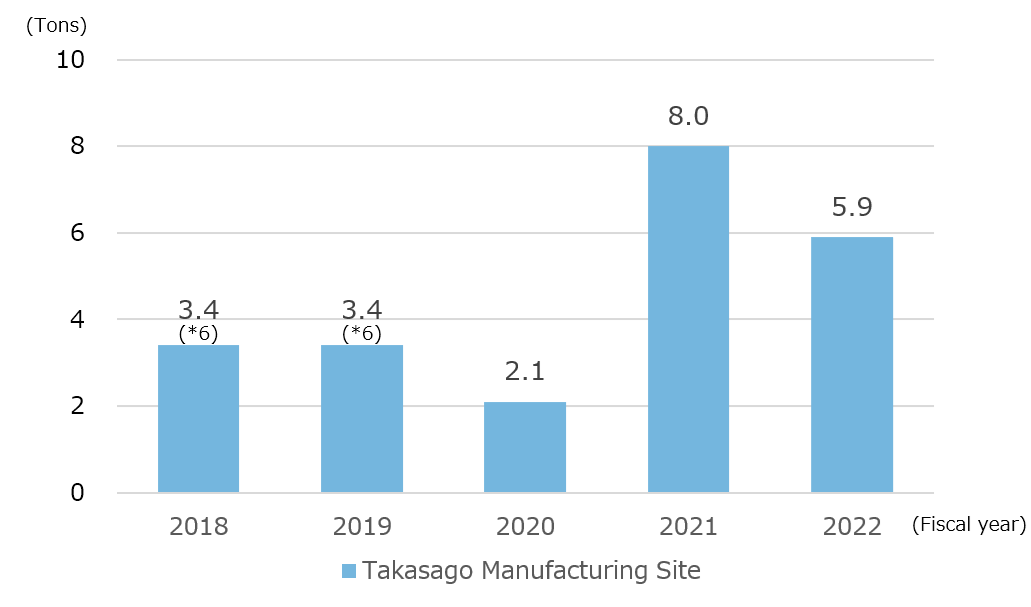
Chloroform Emissions
Acrylonitrile Emissions
1,3-Butadiene Emissions
Dichloromethane Emissions
*9FY2023 figures were revised because some data had been omitted.
Substances Subject to the PRTR Law
Based on the Act on the Assessment of Releases of Specified Chemical Substances in the Environment and the Promotion of Management Improvement (PRTR Law), we calculate the release and transfer amount of chemical substances subject to the law.
Kaneka Emissions Subject to the PRTR Law
(Unit: Kilograms)
| JPSN (Japan PRTR-SDS Number) | Chemical Substances | FY2024 | FY2023 | ||||||
|---|---|---|---|---|---|---|---|---|---|
| Emissions | Transferred | Emissions | |||||||
| Atmospheric Emissions | Discharges into Public Waterways | Discharges into Soil | Internal Landfill | Total | Total | Total | |||
| Large Discharges of 10 Substances | 598 | Chloric acid and its potassium and sodium salt(*10) | 0 | 116,023 | 0 | 0 | 116,023 | 0 | 137,288 |
| 392 | Hexane | 25,645 | 0 | 0 | 0 | 25,645 | 135,758 | 20,699 | |
| 94 | Chloroethylene (synonym: Vinyl chloride) | 15,500 | 561 | 0 | 0 | 16,061 | 946 | 13,632 | |
| 595 | Ethylenediaminetetraacetic acid and its potassium and sodium salts(*11) | 0 | 8,777 | 0 | 0 | 8,777 | 3,442 | 19,521 | |
| 275 | Sodium dodecyl sulfate | 0 | 8,479 | 0 | 0 | 8,479 | 0 | 8,504 | |
| 420 | Methyl methacrylate | 5,304 | 37 | 0 | 0 | 5,341 | 1 | 5,024 | |
| 134 | Vinyl acetate | 4,912 | 312 | 0 | 0 | 5,224 | 0 | 14,257 | |
| 232 | N,N-Dimethylformamide | 3,446 | 1,212 | 0 | 0 | 4,658 | 233,547 | 3,418 | |
| 7 | Butyl acrylate | 4,447 | 1 | 0 | 0 | 4,448 | 3,737 | 3,313 | |
| 157 | 1,2-Dichloroethane | 3,817 | 163 | 0 | 0 | 3,980 | 0 | 2,998 | |
| Total Other than the 10 Substances Above | 15,418 | 5,148 | 0 | 0 | 20,566 | 93,684 | 23,247 | ||
| Grand Total for All Substances | 78,489 | 140,712 | 0 | 0 | 219,200 | 471,115 | 250,901 | ||
Note: Of the 515 substances subject to the PRTR Law, Kaneka reports about 59 items. Amounts reported here may not fully match, due to rounding.
*10FY2023 figures for chloric acid and its potassium and sodium salt were revised because some data had been omitted.
*11From FY2024, the method of calculating ethylenediaminetetraacetic acid and its potassium and sodium salt were revised, from a method using reference values to a method based on actual measurements.
Group Companies in Japan Emissions Subject to the PRTR Law
(Unit: Kilograms)
| JPSN (Japan PRTR-SDS Number) | Chemical Substances | FY2024 | FY2023 | ||||||
|---|---|---|---|---|---|---|---|---|---|
| Emissions | Transferred | Emissions | |||||||
| Atmospheric Emissions | Discharges into Public Waterways | Discharges into Soil | Internal Landfill | Total | Total | Total | |||
| Large Discharges of 10 Substances | 232 | N,N-Dimethylformamide | 42,921 | 0 | 0 | 0 | 42,921 | 16,868 | 35,040 |
| 300 | Toluene | 31,172 | 0 | 0 | 0 | 31,172 | 869,026 | 26,924 | |
| 691 | Trimethylbenzene | 2,711 | 0 | 0 | 0 | 2,711 | 0 | 2,805 | |
| 80 | Xylene | 2,530 | 0 | 0 | 0 | 2,530 | 0 | 2,619 | |
| 186 | Dichloromethane (synonym: Methylene chloride) | 1,580 | 0 | 0 | 0 | 1,580 | 24,440 | 2,528 | |
| 392 | Hexane | 1,000 | 0 | 0 | 0 | 1,000 | 19,516 | 470 | |
| 355 | Bis(2-ethylhexyl) phthalate | 374 | 30 | 0 | 0 | 404 | 227,745 | 345 | |
| 56 | Ethylene oxide | 158 | 0 | 0 | 0 | 158 | 0 | 196 | |
| 438 | Methylnaphthalene | 67 | 0 | 0 | 0 | 67 | 1,534 | 72 | |
| 731 | Heptane | 5 | 0 | 0 | 0 | 5 | 5,339 | - | |
| Total Other than the 10 Substances Above | 4 | 3 | 0 | 0 | 7 | 20,280 | 512 | ||
| Grand Total for All Substances | 82,523 | 33 | 0 | 0 | 82,556 | 1,184,748 | 71,509 | ||
Note:
Of the 515 substances subject to the PRTR Law, Kaneka reports about 35 items.
Amounts reported here may not fully match, due to rounding.
CHECK & ACT
We are working to reduce environmental impacts on air and water quality and ensure rapid response to any abnormality.
Managing Chemical Substances
