Environment
Environmental Performance
By providing solutions that contribute to the global environment and a rich life and working to reduce environmental impacts and disclose timely information in fundamental business domains, Kaneka Group engages in various environmental initiatives.
Note:
For data of indicators related to climate change and environment protection, we have received third-party assurance to ensure the reliability and transparency of Data Sheet 2025 .
For indicator data, some calculation methods have been changed. For details, please refer to “Calculation Methods for Data of Indicators related to Environment.”
The reporting scope covers Kaneka, 51 Group companies in Japan, and 16 overseas Group companies. For a list of companies, please see “Reporting Organizations.”
Material Balance
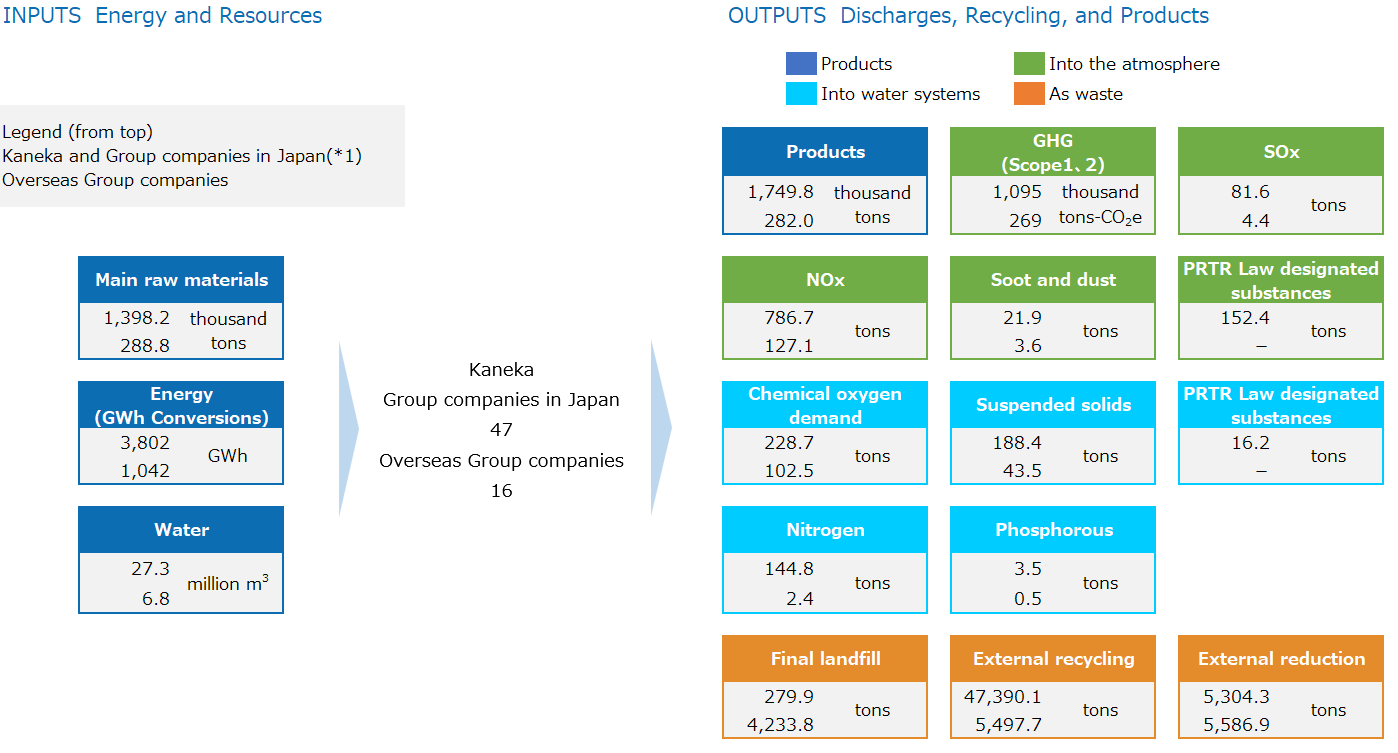
Kaneka Group is working to reduce environmental impacts by aggregating the status of energy and resource inputs and material outputs through emissions and products to grasp production activity volume, targeting Kaneka and Group companies within Japan and overseas.
FY2024 Results
INPUTS (Energy and Resources)
| Items | Units | Kaneka Group | (From top) Kaneka Group companies in Japan Overseas Group companies |
|---|---|---|---|
| Main raw materials | thousand tons | 1,808 | 1,115 272 421 |
| Energy | GWh | 5,402 | 4,042 468 892 |
| Water | million m3 | 36.2 | 26.0 2.9 7.3 |
| Kaneka | 51 Group companies in Japan |
16 Overseas Group companies |
OUTPUTS (Discharges, Recycling, and Products)
| Products | |||
|---|---|---|---|
| Products | thousand tons | 2,002 | 1,510 223 269 |
| Into the atmosphere | |||
| GHG(Scope 1, 2) | thousand tons-CO2e | 1,527 | 1,135 133 259 |
| SOx | tons | 66.2 | 53.6 10.9 1.8 |
| NOx | tons | 949.6 | 773.0 46.0 130.6 |
| Soot and dust | tons | 22.2 | 17.1 1.4 3.8 |
| PRTR Law designated substances | tons | 161.0 | 78.5 82.5 - |
| Into water systems | |||
| Chemical oxygen demand | tons | 274.4 | 240.8 7.3 26.2 |
| Nitrogen | tons | 164.0 | 162.5 1.5 0.1 |
| Phosphorus | tons | 4.3 | 4.2 0.1 0.0 |
| Suspended solids | tons | 240.3 | 219.7 5.3 15.3 |
| PRTR Law designated substances | tons | 140.7 | 140.7 0.0 - |
| As waste | |||
| Final landfill | tons | 3,764 | 5.9 221 3,538 |
| External recycling | tons | 65,527 | 50,142 8,933 6,452 |
| External reduction | tons | 9,123 | 343 4,470 4,310 |
Environmental Accounting
We efficiently and effectively promote environmental conservation activities by quantitatively grasping the investment and expenditure costs related to environmental conservation and the quantitative and economic impacts of environmental measures. We calculate these costs and effects based on the 2005 edition of the Environmental Accounting Guidelines by Japan’s Ministry of the Environment with Kaneka’s own unique way of thinking, targeting all parent manufacturing sites and Group companies in Japan (manufacturing companies).
Environmental Costs (Investments, Expenditures)
(Millions of yen)
| Cost Classifications | Main Efforts | FY2022 | FY2023 | FY2024 | ||||
|---|---|---|---|---|---|---|---|---|
| Investments | Expenditures | Investments | Expenditures | Investments | Expenditures | |||
| Business Area | 893 | 6,350 | 1,147 | 6,696 | 1,420 | 7,292 | ||
| 1. Pollution Prevention | Air and water pollution prevention | 835 | 4,124 | 1,073 | 4,283 | 1,337 | 4,874 | |
| 2. Environmental Conservation | Addressing climate change and energy saving | - | - | - | - | - | - | |
| 3. Resource Recycling | Waste processing, recycling, and reduction | 59 | 2,227 | 74 | 2,412 | 83 | 2,418 | |
| Upstream and Downstream | Product recycling, collection, and processing | 0 | 24 | 0 | 17 | 12 | 14 | |
| Management Activities | Environmental education for employees and environmental impact monitoring and measurement | 0 | 423 | 2 | 388 | 18 | 440 | |
| Research and Development | Research and development of products contributing to environmental conservation | - | 11,876 | - | 12,387 | - | 15,319 | |
| Social Activities | Greening, beautification, and disclosure of environmental information | 0 | 84 | 2 | 74 | 0 | 74 | |
| Environmental Damage | Payment of sulfur oxide emission charges | 0 | 9 | 0 | 9 | 0 | 6 | |
| Total | 893 | 18,766 | 1,151 | 19,570 | 1,450 | 23,145 | ||
Note: Figures do not include global environment conservation investments and expenditures and research and development investments. Amounts reported here may not fully match, due to rounding.
Quantitative Impact of Environmental Conservation Efforts
| Category | Initiatives | Items | Units | FY2022 | FY2023 | FY2024 |
|---|---|---|---|---|---|---|
| Pollution Prevention | Atmospheric and water discharges of hazardous substances | SOx emissions | Tons | 81.6 | 49.7 | 64.4 |
| NOx emissions | Tons | 786.7 | 699.6 | 819.0 | ||
| Chemical oxygen demand | Tons | 228.7 | 236.9 | 248.2 | ||
| PRTR Law‒designated chemical emissions | Tons | 168.6 | 323.4(*1) | 301.8 | ||
| Environment | Greenhouse gas emissions | GHG emissions | Thousand tons-CO2e | 1,095 | 1,236 | 1,268 |
| Energy consumptions | GWh Conversions | GWh | 3,802 | 4,287 | 4,510 | |
| Resource Recycling | Final landfill | Landfill | Tons | 279.9 | 308.0 | 226.8 |
| External recycling | Amounts recycled | Tons | 47,390 | 49,056 | 59,075 |
*1FY2023 figures for chloric acid and its potassium and sodium salt were revised because some data had been omitted.
Economic Impacts of Environmental Measures
(Millions of yen)
| Measures | FY2022 | FY2023 | FY2024 |
|---|---|---|---|
| Revenue from recycling | 198 | 230 | 240 |
| Cost reductions by better resource efficiency (output per unit of input) | -134 | 799 | 573 |
| Waste disposal cost reductions by recycling | 306 | 200 | 112 |
| Cost reductions by energy conservation | 84 | 364 | -81 |
| Total | 453 | 1,593 | 844 |
Note: Amounts reported here may not fully match, due to rounding.
Environmental Investments (Kaneka)
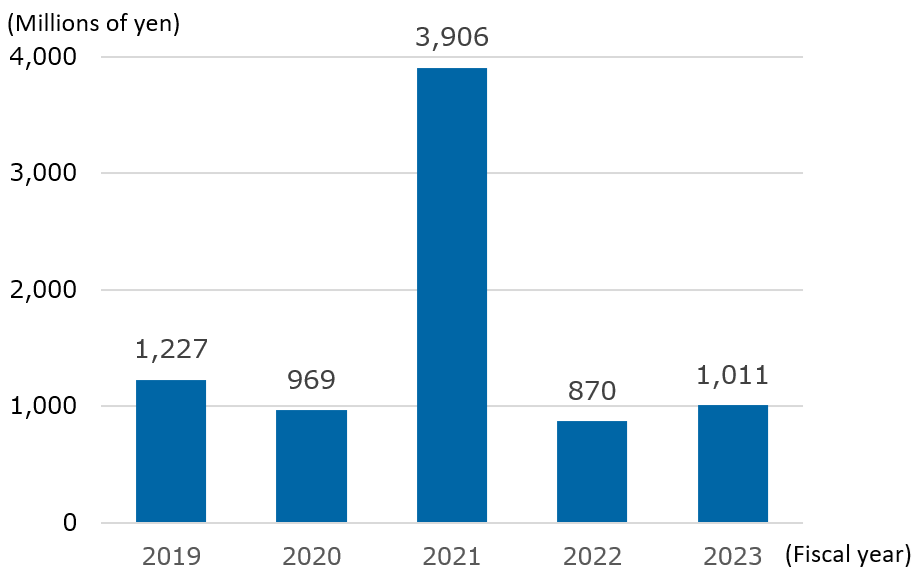
We continue to invest in environmental conservation.
Environmental investments in FY2024 totaled 1,377 million yen.
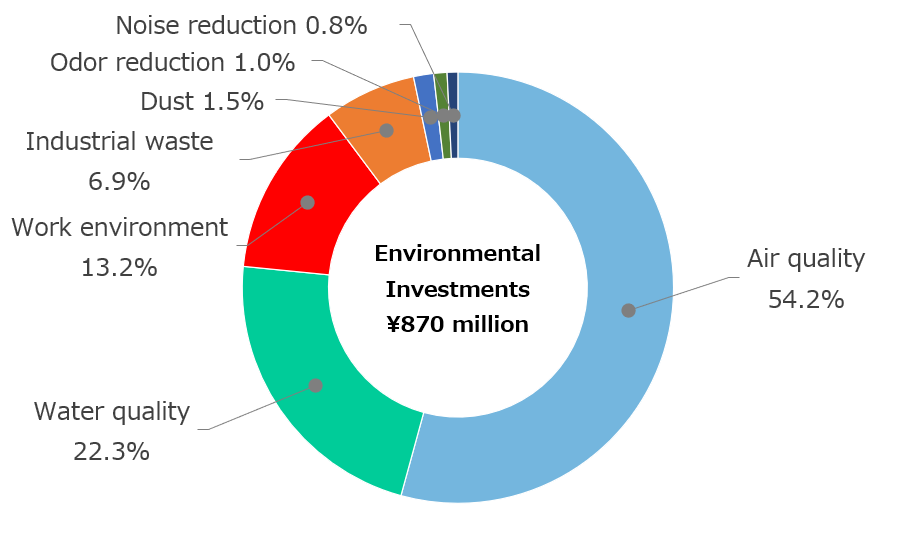
Environmental investments averaged approximately 1,600 million yen over the past five years, leading with water quality (50.1%), followed by air quality (33.2%) and the work environment (9.0%). We will continue to invest proactively to maintain and improve the environment.
Environmental Investments in FY2024
Cumulative Environmental Investments
Environment Efficiency (Kaneka)
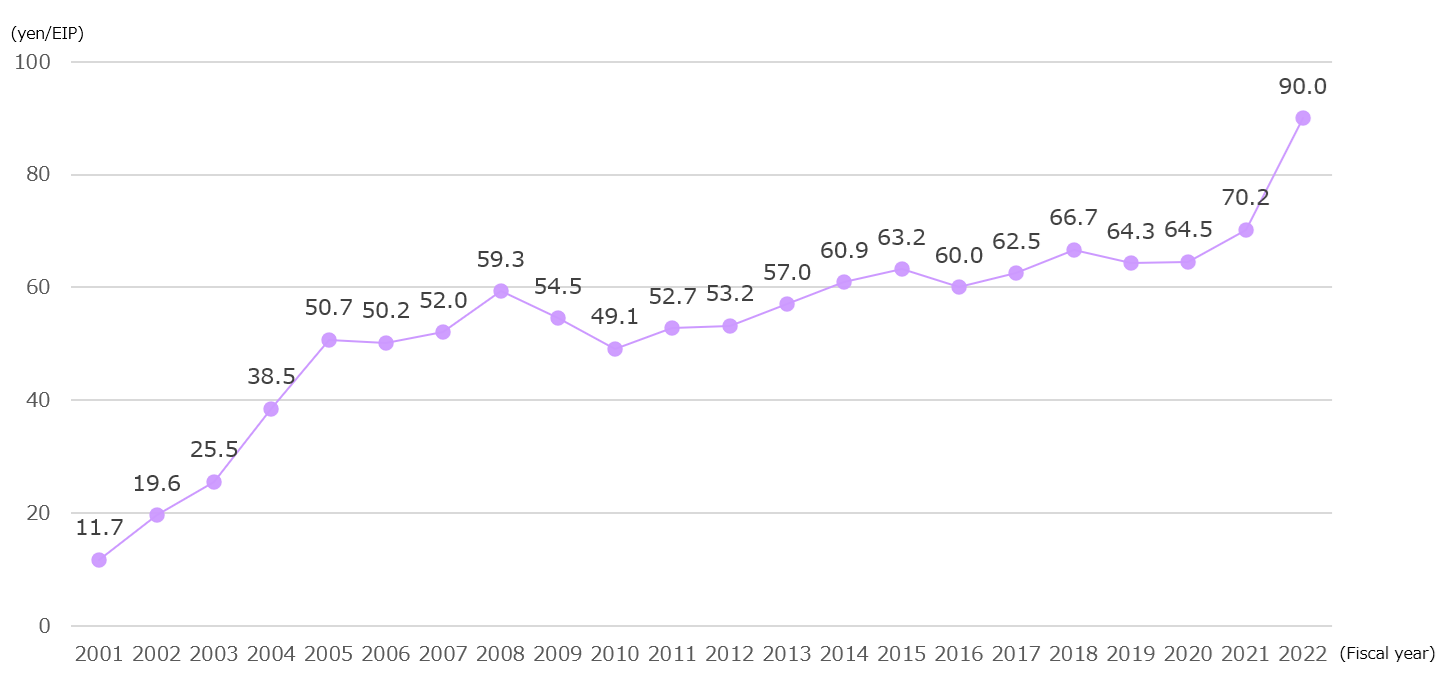
Kaneka assesses the environmental impact of our production activities using Environmental Impact Points (EIPs), which are compiled using the JEPIX methodology, and we use these points to assess our environmental efficiency.
Our total environmental impact for FY2024 amounted to 4.52 billion EIPs. While hazardous air pollutants decreased, this was primarily due to increased emissions of nitrogen, NOx, and phosphorus. Total environmental impact increased by 0.9%, while environmental efficiency declined by 2.1% compared with the previous fiscal year.
Environment Efficiency
Details of Total Environmental Impact
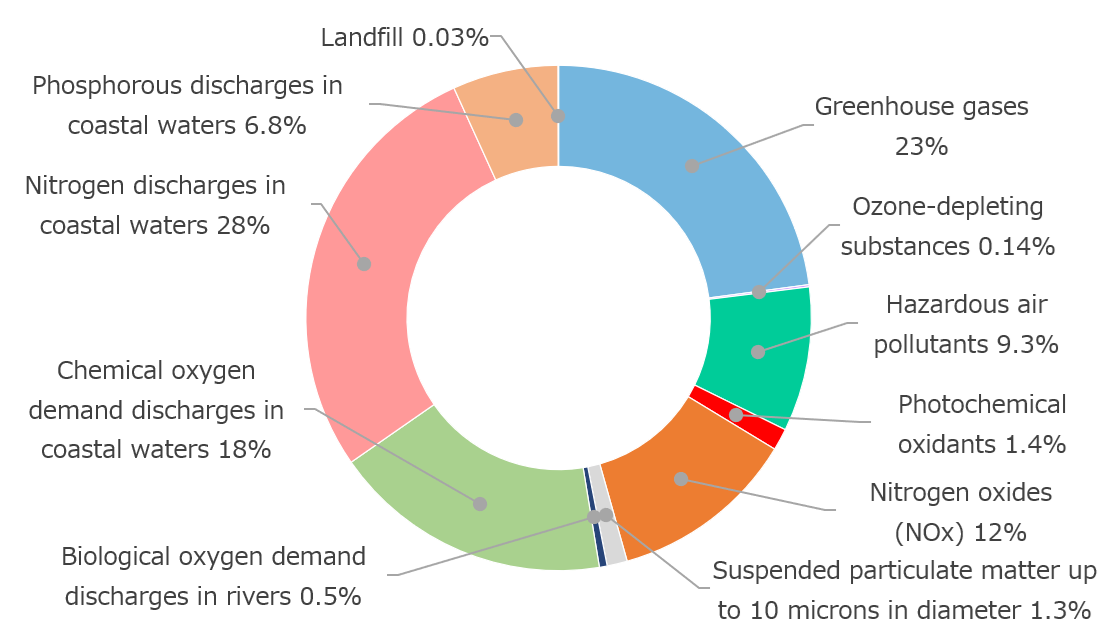
| FY | Net Sales (million yen) | Environmental Impact (100 million EIPs) | Environmental Efficiency (yen/EIP) |
|---|---|---|---|
| 2022 | 369,172 | 41.0 | 90.0 |
| 2023 | 366,950 | 41.1 | 89.2 |
| 2024 | 393,534 | 45.2 | 87.1 |
CHECK & ACT
Under environmentally friendly management, we continue working to reduce environmental risks by complying with environmental regulations and legislation and criteria in agreements with local governments and by checking compliance with them through various means, including ISO 14001 internal audits and ESG safety and quality inspections.
We will also continue working to further reduce environmental impact and improve environmental efficiency by visualizing greenhouse gas emissions and promoting energy conservation activities.
