Environment
Climate Change Initiatives
- Initiatives for Climate Change: Information Disclosure in Line with TCFD
- Energy Conservation Efforts
- Actions to Reduce CO2 Emission Intensity
- GHG Emissions from Business Activities throughout the Supply Chain
- Investments in Energy-Efficient Facilities
- Eco-Friendly Products
- Energy-Efficiency Initiatives in Logistics
- Response to the Fluorocarbons Emission Control Law
To address global warming, we are working to promote energy conservation and reduce CO2 emissions through a range of measures, including our own environmental capital investment program.
We are implementing life cycle assessment (LCA) for our main products and intend to successively expand the range of products covered going forward. We are also working to introduce carbon-life cycle analysis (cLCA) and indirect GHG emissions calculation. Carbon-life cycle analysis (cLCA) uses an LCA-based quantitative evaluation to calculate the contribution to GHG emissions reduction relative to comparable products. Indirect GHG emissions calculation covers business activities throughout the supply chain (Scope 3 emissions).
Note:
For data of indicators related to climate change and environment protection, we have received third-party assurance to ensure the reliability and transparency of Data Sheet 2025 .
For indicator data, some calculation methods have been changed. For details, please refer to “Calculation Methods for Data of Indicators related to Environment.”
The reporting scope covers Kaneka, 51 Group companies in Japan, and 16 overseas Group companies. For a list of companies, please see “Reporting Organizations.”
Initiatives for Climate Change: Information Disclosure in Line with TCFD
With people and technology growing together into creative fusion, we will break fresh ground for the future and tie in to explore New Values. We are also committed to challenge the environmental issues of our planet and contribute to upgrading the quality of life. Guided by this corporate philosophy, Kaneka Group will leverage its products and services to globally offer useful solutions to the issue of climate change, and will fulfill its social responsibilities regarding the various climate change-related impacts associated with the production and distribution processes. As part of this, we expressed our support for the recommendations of the Task Force on Climate-related Financial Disclosures (TCFD) in March 2021.
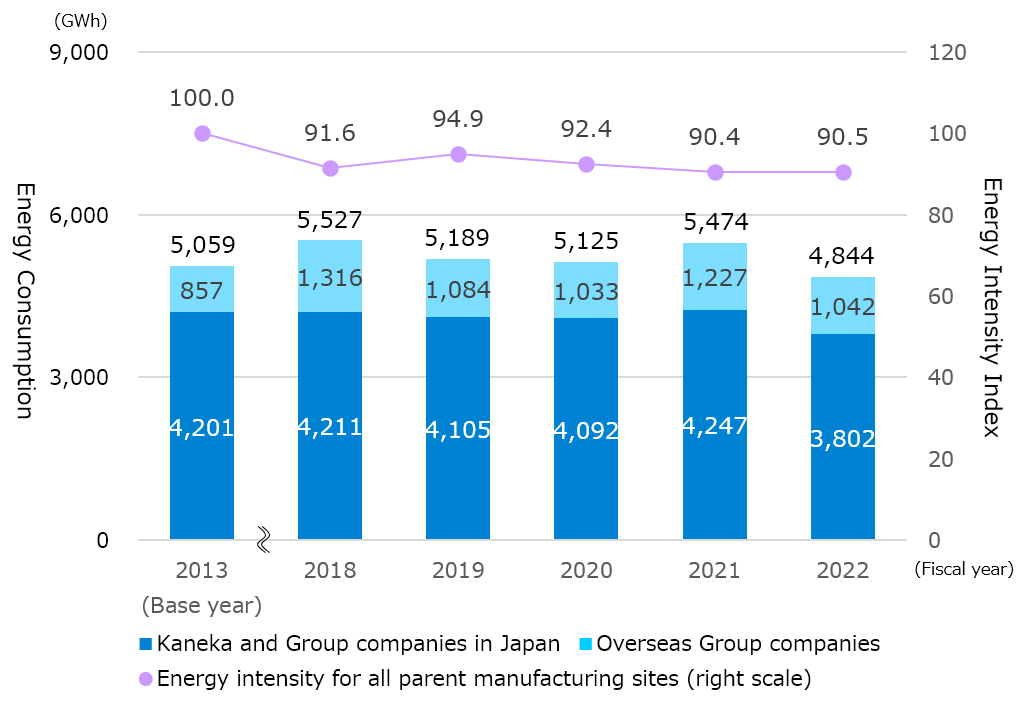
Energy Conservation Efforts
We are engaged in energy conservation activities, using the energy intensity index as an indicator for management.
In FY2024, the energy intensity index at four manufacturing sites(*1) was 95.6, a decrease of 0.6% from the previous fiscal year. The average rate of change over the five-year period was 100.9%, and the target of an average annual 1% reduction was not met.
The Kaneka Group’s energy consumption was 5,402 GWh, an increase of 1.9% from the previous fiscal year, mainly due to increased production volume.
*1Four parent manufacturing sites: Takasago Manufacturing Site, Osaka Manufacturing Site, Shiga Manufacturing Site, and Kashima Manufacturing Site. The Tomatoh (Hokkaido) Manufacturing Site, completed in August 2024, is not included.
Targets and Performance/Evaluation
| FY2024 target | FY2024 performance | Evaluation | |
|---|---|---|---|
| Energy intensity index | Average annual reduction of 1% or more | 95.6 (four parent manufacturing sites(*1)) (99.4% year-on-year change) |
× |
| Five-year average change rate 100.9% | × | ||
Energy Consumptions and Energy Intensity Index
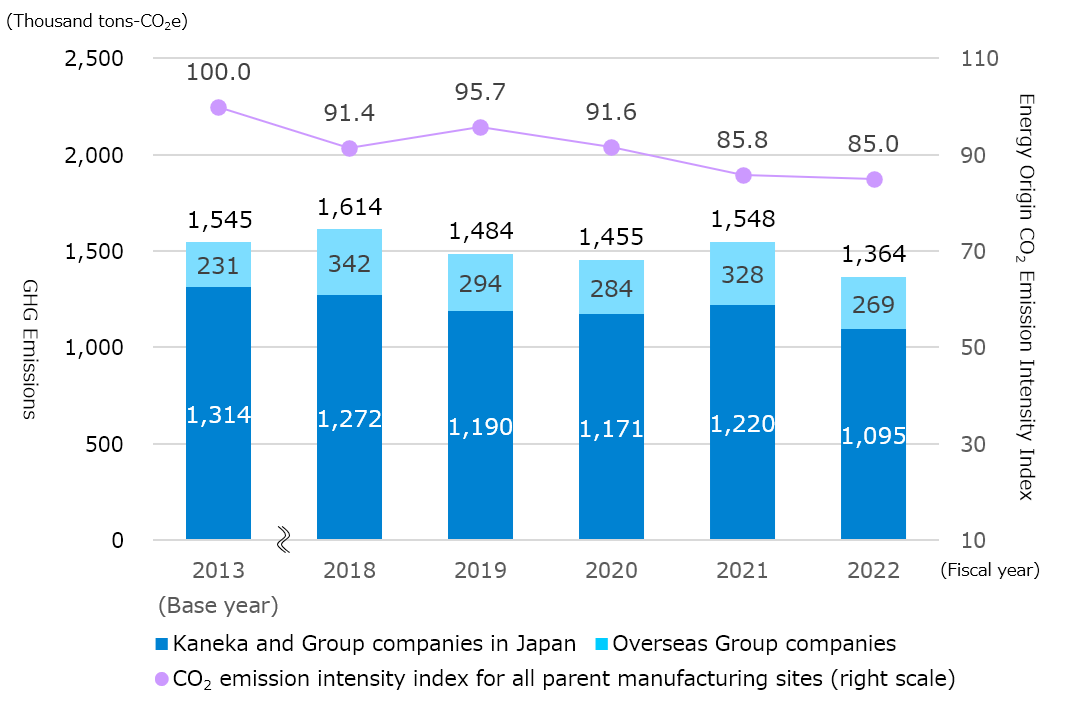
Actions to Reduce CO2 Emission Intensity
We are working to reduce energy origin CO2 emission intensity, using a CO2 emission intensity index as an indicator for management, based on CO2 emissions from energy consumption associated with production activities.
In FY2024, the energy origin CO2 emissions intensity index for four parent manufacturing sites(*1) was 86.4, exceeding our FY2024 target of 89.5 (toward a FY2030 target of 84.3). Greenhouse gas (GHG) emissions for the Kaneka Group were 1,527 thousand tons-CO2e, up 0.1% from the previous fiscal year, due in part to increased production volume. Going forward, we will continue to take energy saving actions and, based on our strategy for carbon neutrality, will work to reduce GHG emissions by means of actions such as streamlining production processes through innovation and switching to alternative fuels.
*1Four parent manufacturing sites: Takasago Manufacturing Site, Osaka Manufacturing Site, Shiga Manufacturing Site, and Kashima Manufacturing Site. The Tomatoh (Hokkaido) Manufacturing Site, completed in August 2024, is not included.
Targets and Performance/Evaluation
| FY2024 target | FY2024 performance | Evaluation | |
|---|---|---|---|
| Energy origin CO2 emission intensity index | Average annual reduction of 1% or more (fixed emissions factor) Estimated FY2024 performance 89.5 (FY2030 target 84.3) |
86.4 (four parent manufacturing sites(*1)) | ◎ |
GHG Emissions and Energy Origin CO2 Emission Intensity Index
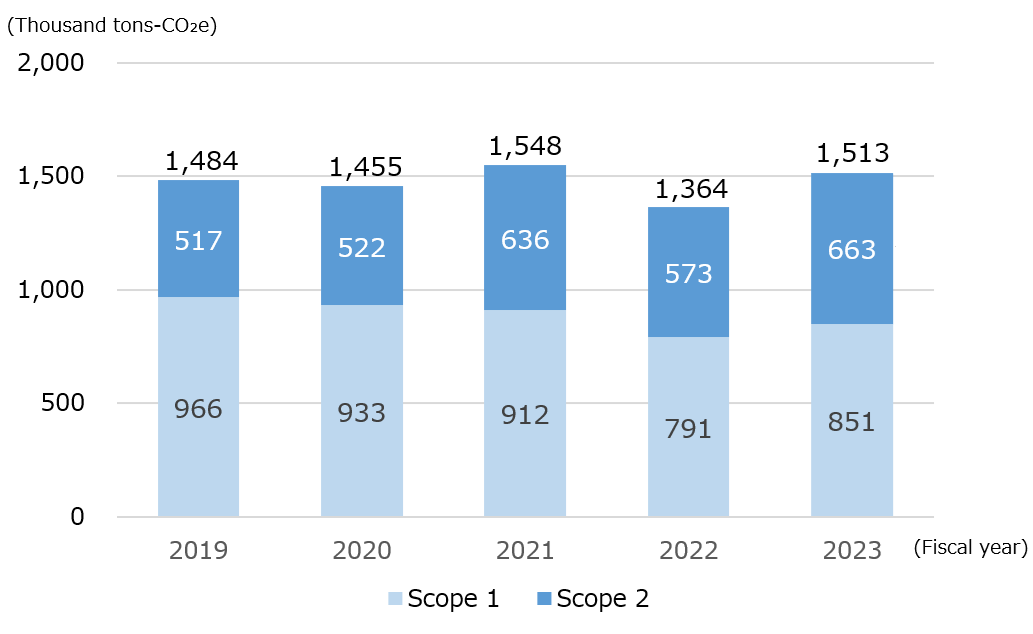
Scope 1 and 2 Emissions (Kaneka)
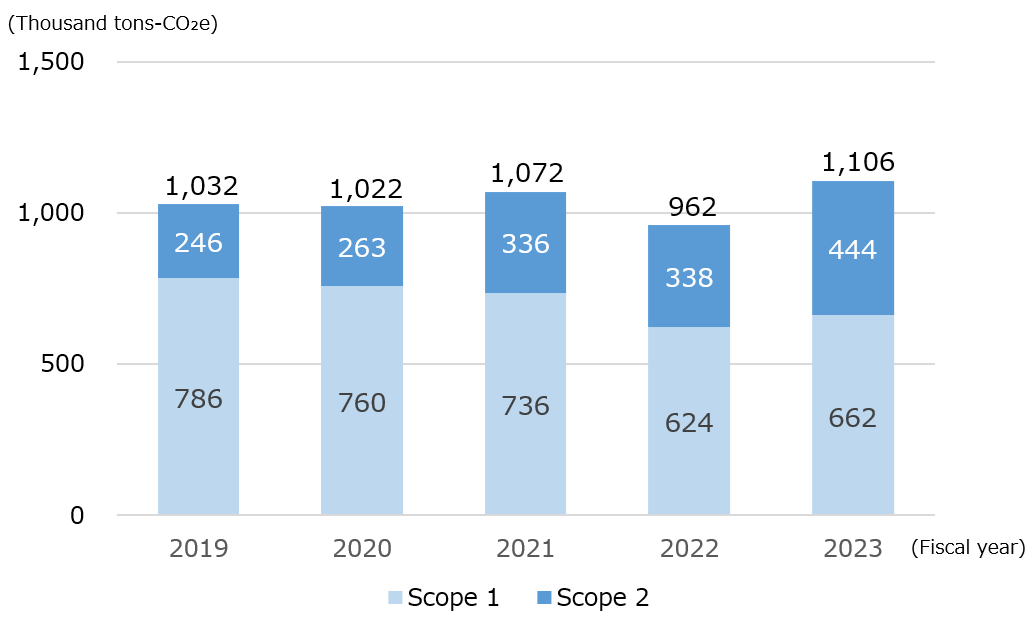
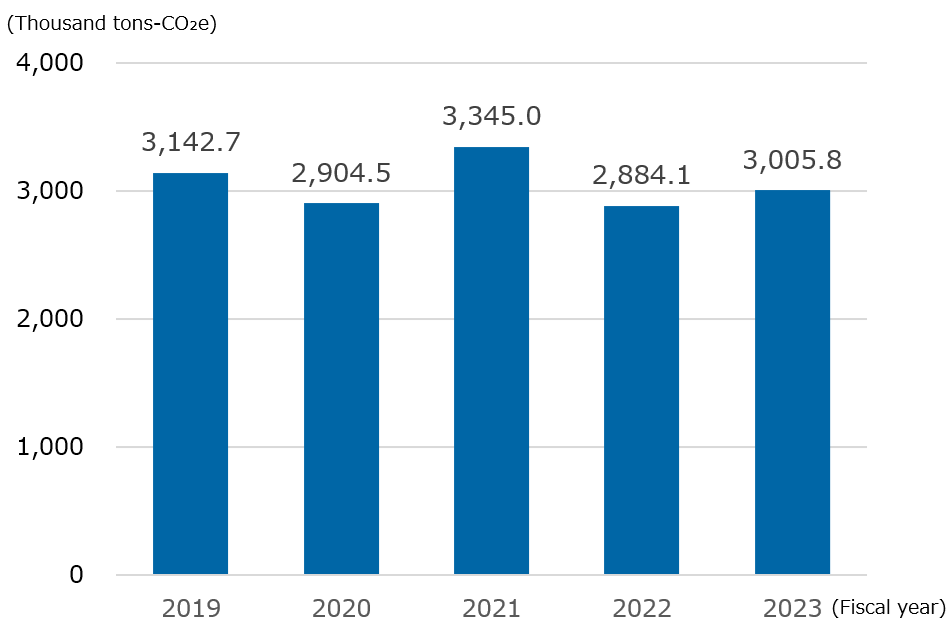
Scope 1 and 2 Emissions (Kaneka Group)
Kaneka Group Scope 1 and 2 Emissions (FY2024)
(Thousand tons-CO2e)
| Kaneka | Group companies in Japan |
Overseas Group companies |
Total | |
|---|---|---|---|---|
| Scope1 direct emissions(*2) |
756 | 63 | 134 | 954 |
| Scope2 indirect emissions from purchased or acquired electricity, steam, heat and cooling(*3) |
378 | 70 | 125 | 573 |
| Total | 1,135 | 133 | 259 | 1,527 |
Note: Amounts reported here may not fully match, due to rounding.
*2 Non-energy CO2 emissions and CO2-equivalent of methane, N2O, and NF3 emissions are included.
*3 Scope 2 emissions calculated using the location-based method were 388 thousand tons-CO2e for Kaneka and 68 thousand tons-CO2e for Group companies in Japan. For overseas Group companies, Scope 2 emissions were the same calculated using location-based and market-based methods.
GHG Emissions from Business Activities throughout the Supply Chain
We calculate indirect GHG emissions associated with our business activities across the supply chain. Kaneka had previously based its calculation of Scope 3 emissions on Kaneka, the parent company, but starting from the FY2022 results, we began calculating selected Scope 3 categories for Group companies. A dash (“-”) in the table indicates data that has not been calculated.
Kaneka Group Scope 3 Emissions Calculated by Category (FY2024)
(Thousand tons-CO2e)
| Category | Kaneka | Group companies in Japan |
Overseas Group companies |
Total | |
|---|---|---|---|---|---|
| 1 | Purchased goods/services | 1,907.3 | - | - | 1,907.3 |
| 2 | Capital goods | 84.7 | 17.9 | 53.0 | 155.6 |
| 3 | Fuel-and energy-related activities not included in Scope 1 or Scope 2 | 162.4 | 25.8 | 29.9 | 218.2 |
| 4 | Upstream transportation and distribution | 22.4 | - | - | 22.4 |
| 5 | Waste generated in operations (*4) | 4.4 | 7.7 | 7.1 | 19.2 |
| 6 | Business travel | 6.3 | 0.5 | 0.4 | 7.2 |
| 7 | Employee commuting | 1.2 | 1.5 | 1.2 | 3.9 |
| 8 | Upstream leased assets | 0.0 | - | - | 0.0 |
| 9 | Downstream transportation and distribution | (*5) | (*5) | (*5) | (*5) |
| 10 | Processing of sold products | (*5) | (*5) | (*5) | (*5) |
| 11 | Use of sold products | (*6) | (*6) | (*6) | (*6) |
| 12 | End-of-life treatment of sold products | 521.2 | 111.4 | 214.4(*7) | 847.0 |
| 13 | Downstream leased assets | 0.02 | - | - | 0.02 |
| 14 | Franchises | (*8) | - | - | - |
| 15 | Investments | 404.1 | - | - | 404.1 |
| Total of Scope 3 emissions | 3,114.0 | 164.9 | 306.0 | 3,584.9 | |
Note: Amounts reported here may not fully match, due to rounding. A dash (“-”) in the table indicates data that has not been calculated.
*4 CO2 emissions from waste transportation are not included in category 5 but are calculated in category 4.
*5 Since we were unable to determine a rational calculation method due to the high percentage of intermediate products, GHG emissions for this category were excluded from the calculation range.
*6 Some products generate emissions when used. However, since it was confirmed that this represented less than 0.1% of total Scope 3 emissions, such emissions were excluded from the calculation range.
*7 Kaneka Medical Vietnam Co., Ltd. is not included in the calculation because its products have not been converted to weight.
*8 GHG emissions for this category were not calculated because we have no franchise stores.
Scope 3 Emissions (Kaneka)
*9 To improve the accuracy of calculations in Category 1, the selection of product names in the LCI database IDEA and the multiplier used for conversion to units in the database were revised. FY2022 and FY2023 figures have been revised as a result.
Investments in Energy-Efficient Facilities
To promote the continuous reduction of energy intensity and CO2 emission intensity, we operate an environmental capital investment program. This program has an annual budget of 300 million yen for small and medium-sized investment projects with relatively long payback periods. To strengthen climate change countermeasures, we increased the investment budget from 200 million yen to 300 million yen in FY2021.
The program operates under three areas that are priorities in Kaneka’s environmental management program: global warming prevention, effective use of resources, and environmental impact reduction. In FY2024 we continued allocating a large portion of this fund to projects that address climate change, including broader initiatives such as visualizing energy consumption. We will continue to effectively leverage this investment program to promote energy conservation and GHG emission reduction activities.
Results of Our Own Environmental Capital Investment Program
| FY | Investments (million yen) |
Number | Reduced CO2 Emission of the Year |
|---|---|---|---|
| 2020 | 200 | 27 | 1,010 tons-CO2 |
| 2021 | 300 | 36 | 1,757 tons-CO2 |
| 2022 | 300 | 30 | 2,319 tons-CO2 |
| 2023 | 300 | 38 | 3,692 tons-CO2 |
| 2024 | 300 | 30 | 3,512 tons-CO2 |
Eco-Friendly Products
Kaneka Group has focused on eco-friendly management since FY2017. We have enhanced and expanded our lineup of eco-friendly products, which we define as products that help reduce the burden on the natural environment compared to conventional products at the customer use, disposal, and recycling stages (see the table below).
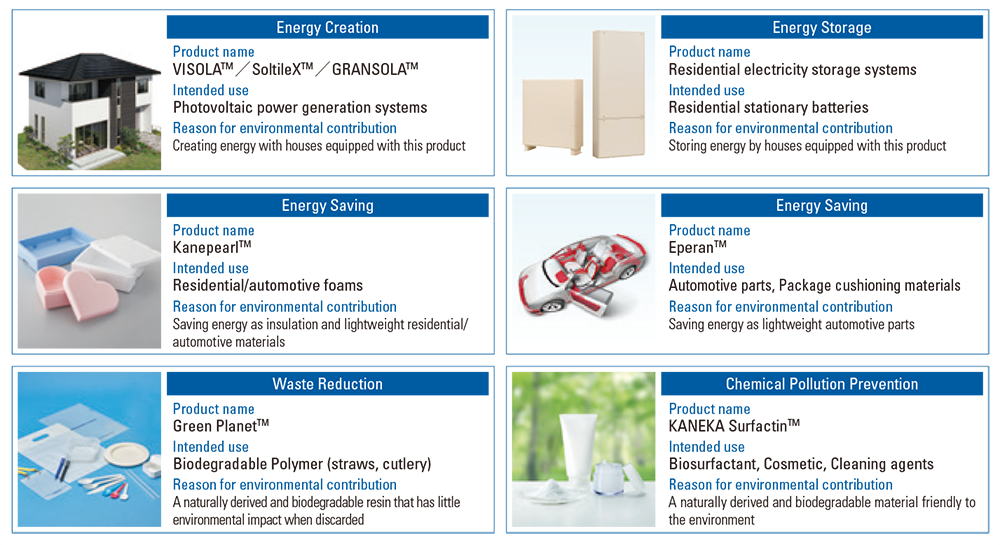
Eco-friendly products have been defined as follows.
| Type of Environmental Contribution | Qualitative Definition |
|---|---|
| GHG Reduction | Products reducing greenhouse gas (GHG) emissions |
| Energy Saving | Products lowering energy consumption |
| Energy Creation | Products creating energy |
| Energy Storage | Products storing energy |
| Waste Reduction | Products reducing waste |
| Resource Saving | Products achieving resource savings |
| Biomass | Products (derived from non-fossil materials) reducing reliance on fossil materials |
| Water Resources | Products saving water and improving the water environment |
| Chemical Pollution | Products preventing chemical pollution |
| Biodiversity | Products conserving biodiversity |
| Intermediate Materials | Intermediate materials essential to ensuring that finished products contribute to the environment |
| Disaster Control | Products helping disaster prevention and preparedness and reducing environmental impacts during a disaster |
| Adaptive Contribution | Products adapting to global warming |
Energy-Efficiency Initiatives in Logistics
As a designated consignor under the revised Act on the Rational Use of Energy, we continue to promote initiatives such as modal shifts (a transition to rail and marine transport), joint delivery, and improved load efficiency, in order to achieve an annual 1% reduction in energy intensity and maintain an average 1% improvement over a five-year period.
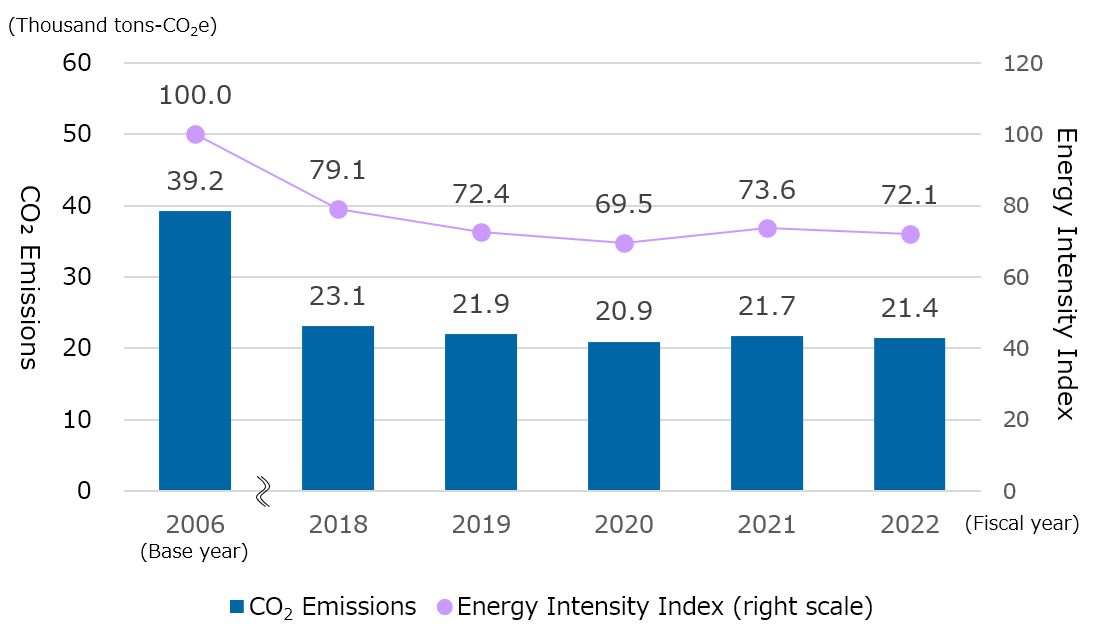
In FY2024, as transportation volume increased in line with higher sales, CO2 emissions totaled 22.4 thousand tons-CO2, an increase of 1.5 thousand tons-CO2 from the previous fiscal year. However, through the use of marine transport from public wharves near factories and improved load efficiency, the energy intensity index was 70.5, a decrease of 4.7% from the previous fiscal year.
We continue to promote modal shifts, including the use of rail transport, and improve load efficiency to enhance transportation efficiency and reduce CO2 emissions.
CO2 Emissions and Energy Intensity Index from Logistics (Kaneka)
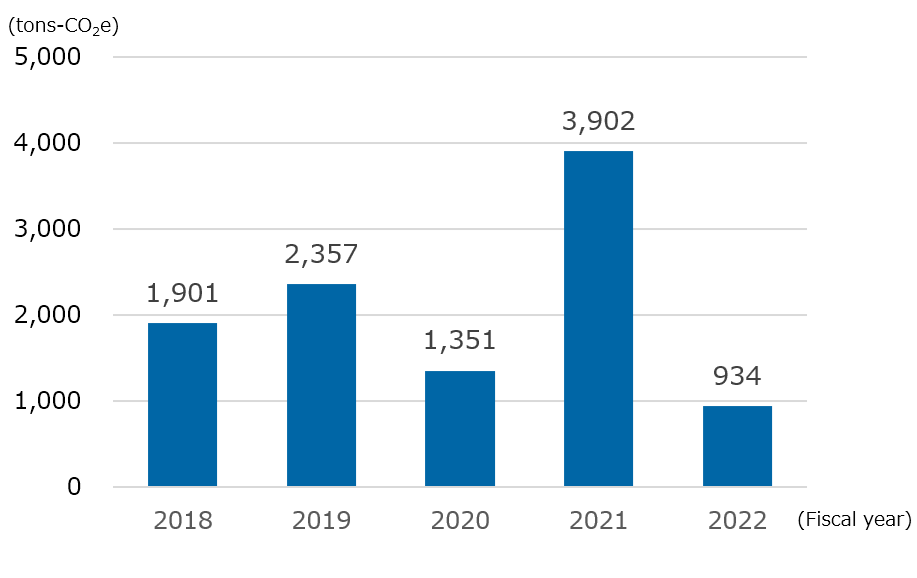
Response to the Fluorocarbons Emission Control Law
Complying with the Act on Rational Use and Proper Management of Fluorocarbons in Japan, we are promoting the replacement of aging equipment that use specified fluorocarbons as well as strengthening our management of equipment.
The estimated leakage of fluorocarbons in FY2024 at Kaneka was 630 tons-CO2e, a decrease of 365 tons-CO2e from the previous fiscal year. We achieved our target of keeping the estimated leakage of fluorocarbons below 1,000 tons-CO2e for the third consecutive year. At Group companies in Japan, there were no estimated fluorocarbon leakages exceeding 1,000 tons-CO2e.
We will continue to systematically update aging equipment and promote the adoption of equipment with low global warming potential(*10) and green refrigerants. We will also strengthen equipment inspections to enable early detection and response to fluorocarbon leaks, thereby reducing such leakage.
*10Global warming potential is a figure that shows, on the basis of carbon dioxide, how other greenhouse gases have the property of causing global warming.
Estimated Leakage of Fluorocarbons (Kaneka)